|
All About Maps
This booklet concerns maps
and how they are made - for that is what cartography is all about. If you have
studied geography you will no doubt know something about cartography but for the
benefit of those who have no knowledge we will be as simple and basic as possible.
Cartography has been defined
as "the art, science and technology of making maps, together with the study
of maps as scientific documents and works of art." This includes all kinds
of maps and they may represent the whole or part of the earth or any heavenly
body and be drawn at any scale. It also includes globes and three-dimensional
models.
A Visual Aid
A map is really just a kind
of visual aid - a picture which conveys a message. Have you ever drawn a simple
sketch map in order to direct someone to some place? You are representing the
locality in picture form to make it easier for the person to find. Verbal directions
would be harder to follow and remember. "Take the first turn on the left
then miss two streets and turn right on the third; go as far as the Post Office,
then ... It can be so very confusing!
Professionally produced
maps exist for basically the same purpose as your own little sketch map. Some
are simple, some are complex but they all convey some kind of information in pictorial
form.
Some maps are highly detailed,
showing a wealth of information including ground shape and elevation as well as
detail such as roads, fences and buildings. Other maps are quite simple and exist
for one purpose only. A road map might show only main routes and names of towns.
A weather map just shows the weather pattern over a given area. The amount and
type of information depicted depends on the nature and purpose of the map.
Although there are many
different kinds of maps we may classify them broadly under three categories:-
topographic, planimetric and thematic.
Topographic Maps
Greek- Topos: A
Place; Graphos: I Write.
A topographic map shows
the shape and the height of the ground (usually referred to as relief) together
with all natural and man-made features relevant to the scale at which the map
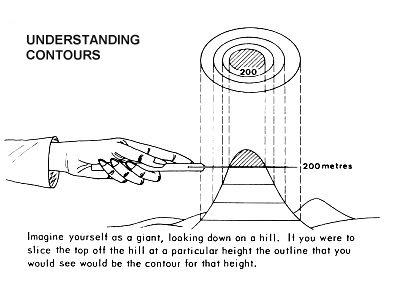
is drawn. Relief is usually depicted by contours drawn regular intervals apart.
An experienced map reader can form a mental picture of the ground shape by studying
contours. If you are unsure what contours are all about, the diagram below will
help you to understand their meaning.
There are several other
methods of showing relief; hill or relief shading (which is sometimes used in
conjunction with contours), hachures and layer tints. These are described on
the next page. It is sometimes argued that maps which use these methods are not
truly topographic but that need not concern us now.
Hill Shading: Hill shading gives an idea of ground shape to inexperienced
eyes by approximating the shadows of hills and mountains as they would appear
when viewed from above. It is usually assumed that the light is falling from the
north west corner of the map.
Hachures: These are short lines drawn in such a way that they will present
an effect of relief. Where the slope is steepest the lines are closest together.
Heights are often shown on the tops of hills but this method does not convey adequate
information for the needs of professional users such as engineers, geologists
or soldiers. Hachures may be seen on many old maps but are rarely used today.
Layer Tints: This method is used in atlases and shows a number of different
height divisions, each in a different colour. For example, all land between sea
level and 250 metres might be shown in a green tint. Land from 250 to 500 metres
might appear in a lighter green, 500 to 750 metres in light brown, 750 to 1,000
metres in a darker brown, and so on. Only an approximate idea of relief can be
conveyed by this method.
Examples of topographic maps are military maps and some of the maps produced by
Federal and State authorities - e.g., 1:25 000, 1:50 000, 1:100 000, 1:250 000
series.
Planimetric Maps
Planimetry: The measurement of plane surfaces (Oxford Dictionary).
We may expand the above definition by stating that planimetry involves the determination
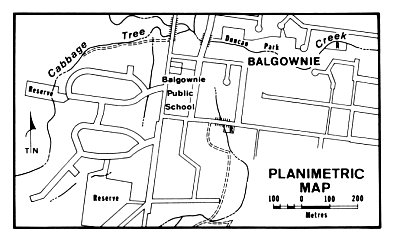
of horizontal distances, angles and areas. A planimetric map shows the location
of boundaries, roads and buildings. Whereas a topographic map shows visible features,
a planimetric map shows boundaries that are not necessarily marked on the ground;
an example of this would be a municipal boundary or a postal division.
Here are some examples of planimetric maps:
Planimetric base maps showing
road pattern, parks, creeks and local government boundaries.
Cadastral maps showing land subdivisions and roads. Title plans and survey maps
which depict the extent and ownership of land belong to this class of map.
Some engineering plans and
designs for construction work involving such things as sewerage, drainage, railway
or road construction. Sometimes these maps also convey topographic information.
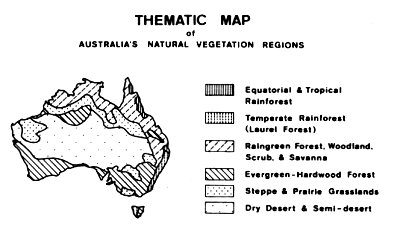
Thematic Maps
These maps deal with a particular
theme as the title suggests. They often use colour to great advantage. Street
guides really fall into this category. Other examples are maps showing density
of population, geological maps indicating mineral resources, daily weather charts
(the ones shown on television are examples), climatic charts showing averages,
maps showing resources of one kind or another - there is almost no limit to the
kind of theme that may be represented in this way.
Maps as Tools
The uses of some of the
maps mentioned above are obvious. Experts in many fields use maps as tools.
Aircraft pilots use aeronautical charts for navigation. Navigation of oceans
and other waterways requires the use of nautical maps and hydrographic charts.
Water depths, shipping routes and other relevant information may be obtained from
these. Maps of Weipa, in the Northern Territory, had to be completed before the
great bauxite deposits there could be exploited. Another specific example is
the Hammersley Range, Western Australia, where vast iron ore deposits are being
mined. Before work could commence, maps were prepared of the area to be mined
and of the route of the railway to Port Hedland.
A list of map users would
be enormous. Planners, geologists, engineers - even economists use maps. And,
of course, we all use them to some extent. Remember the map that we discussed
earlier? The one you drew to direct someone to a particular place. And if we
are motorists we probably carry a street directory in the glove box of the car.
When we are tourists we consult maps of the places we visit and sometimes we use
route maps for buses and trains. Maps affect our lives more than we probably
realise.
How did it all begin?
Mans first attempt to draw a map is lost in the obscurity of time. It probably
goes back to when our ancestors first learnt the art of graphic communication.
In 1899 an archaeologist working near the Euphrates River in Mesopotamia (now
in Iraq) unearthed a clay tablet with strange lines on it. It was a map of the
ancient city of Nippur, situated one hundred kilometres south east of Babylon.
Excavations of the city showed the map to he remarkably accurate. It is at least
3,500 years old and is the oldest known map in existence.
The ancient Greeks produced some fine maps while the Romans made what may have
been the worlds first road maps, showing their excellent communication system
throughout the empire. Early navigators began charting the world's coastlines
as they sailed into unknown waters on discovery voyages. Eventually Australias
turn came. Portuguese ships are said to have charted parts of our coast in the
sixteenth century. A map known as the Dauphine Map, once owned by Sir Joseph
Banks and now in the British Museum, may have been compiled from data gathered
in 1522 by Gistovao de Mendonca. In 1606, Willem Jansz of the Dutch East India
Company sailed along the eastern shore of the Gulf of Carpentaria in the yacht
Duyfken (or Duifken) and gave this country its oldest surviving place name: Cape
Keer-Weer, which means Cape Turn Again, for at this point Jansz decided to head
for home. This is about half way down Cape York Peninsula on the western side.
Although other Dutch ships sailed by the Australian coast in the next few years
it was not until 1644 that Abel Tasman sailed from Cape York to the west coast
and the shape of Australia (or New Holland as it was then known) began to appear
in map form.
Captain James Cook was a superb navigator and cartographer and he charted much
of the Pacific area from the west coast of Canada right across to Australia.
He sailed around New Zealand, proving that it was not part of a larger mythical
continent as some had believed.
|
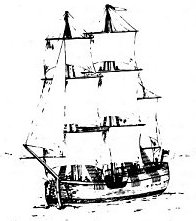
H.M.
Bark Endeavour sailed from Plymouth under the command of
Lt. James Cook on 26th August 1768 and reached Botany Bay
on 29th April 1770.
|
He pioneered the use of
the chronometer, which had been developed as an accurate timepiece by the time
he sailed on his second voyage of discovery in 1772 in the Resolution. (Longitude
is determined with a chronometer set to Greenwich mean time. It is the angular
distance - expressed in degrees and minutes - east or west of the prime meridian,
which is Greenwich, at 0 degrees. It is calculated from the difference between
Greenwich mean time and local time which is checked at noon each day. Prior to
the use of chronometers longitude had to be worked out from a set of complicated
tables after observing the moon, if it happened to be visible. The method was
unreliable. Latitude, also expressed in degrees and minutes, is the angular distance
north or south of the equator. It is determined by measuring the sun's altitude
with a sextant. Latitude and longitude together give a geographical position
anywhere in the world).
Matthew Flinders charted much of Australia' s coastline. He began at Cape Leeuwin
in Western Australia and sailed in an easterly direction, reaching Port Jackson
in May, 1802. He later continued north as far as Arnhem Land where circumstances
forced him to abandon his task. Philip Parker King (son of Philip Gidley King)
charted much of the remainder of the coast but left some gaps, most of which were
filled in by John Lort Stokes who sailed in the Beagle, the ship that had once
carried the famous naturalist, Charles Darwin on a world trip. In September,
1839, Stokes named Port Darwin after the naturalist.
There were two important historical milestones that were to give a great impetus
to map making. These were the development of paper and the invention of the printing
press. Through the medium of print on paper, maps were able to be made available
to more people than ever before.
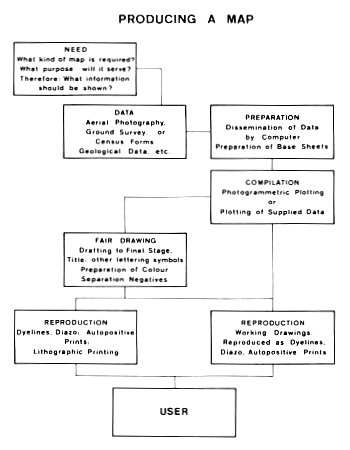
Producing a Map
Some people believe that drawing maps is all that there is to cartography. Of
course, drafting is a very -important and integral part of map production. But
that is not the whole story. Cartography is based on mathematics, including geodesy
(which is a type of mathematics that deals with measurement of the earths shape
and surface), and geography. It involves graphic art, design and photography.
A cartographer may require a knowledge of these and even of the lithographic printing
process. A cartographer will need to know something about map projections, possibly
something about surveying, and may need some knowledge of computer science. Cartography
is concerned with all stages of map production from the collection of the original
data needed to draw the map right through to the finished product.
In order to draw a map the
cartographer needs a certain amount of basic information. Data comes from a wide
variety of sources depending on the type of map that is being produced. Information
to be shown on a geological map will come from geologists working in the field.
Market surveys, census forms or weather information might be the basis of particular
maps. Topographic maps are usually produced from aerial photographs through the
use of stereoscopic plotting instruments (see 'Photogrammetry'). Basic ground
survey is necessary to establish a true scale and to make sure that all heights
read correctly in relation to each other.
The Age of the Specialist
Today is the age of the specialist. This applies no less to cartography than
it does to other fields. A number of professions or sciences are either allied
to or fall under the broad spectrum of cartography. A cartographer might be a
specialist in any one of them.
Surveying
Surveying might be said to be allied to cartography: indeed a whole map can be
produced by ground survey methods. However, while this is economical for small
areas it is extremely time consuming for larger ones. Greater speed and a more
accurate interpretation of ground shape can be obtained through photogrammetric
techniques. (see Photogrammetry). Ground survey supplies more precise readings
of height and distance than is possible by photogrammetry but ground shape is
determined by covering the area with a network of heights (known as levels) and
drawing contours to fit them. The closer the network the more accurate the contours.
In photogrammetry the operator actually sees the shape of the ground and is able
to plot every hill or hollow, subject to the limits of the photography.
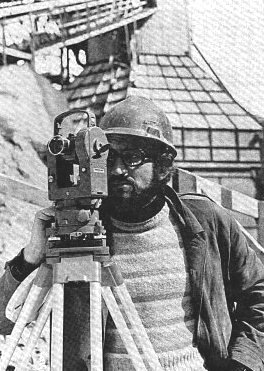
| A surveyor
uses a Wild theodolite on a construction site. This instrument
is used to measure horizontal and vertical angles from which
it is possible to determine both heights and positions of
points. |
The basic data required for photogrammetric mapping is supplied
by ground survey as previously mentioned. Co-ordinates of known
points are supplied and these enable the photogrammetrist to establish
a correct scale and to ensure that the position of any point on
the map can be determined. These known points might be points
of detail, such as poles or fence corners, or else they may be
specially laid targets which show as white crosses on aerial photographs.
In addition to this information, heights are also supplied for
certain identifiable points. These enable the instrument to be
adjusted so that a correct height may be read at any position
on the photographic image which the operator sees. Accurate contours
may then be drawn.
Photography
Most of us are amateur photographers of one kind or another.
But photography can be a very serious business and plays an important
role in industry and commerce. Photographic techniques are associated
with cartography in several different ways. Photogrammetry, for
example, is based entirely on photographs, though as a science
it is vastly different from photography.
Photographs used in photogrammetry are, in most instances taken
from the air. (The kind of photogrammetry which uses photographs
taken on the ground is described later). The rolls of film normally
used are about forty metres long and the format of each photograph
is 229 millimetres (9 inches) square. As you may imagine, the
cameras are not very much like your pocket lnstamatic. Cameras
used are quite large, as cameras go, and youve guessed it -
extremely expensive, running into many thousands of dollars.
The lenses are super accurate because fine measurements have to
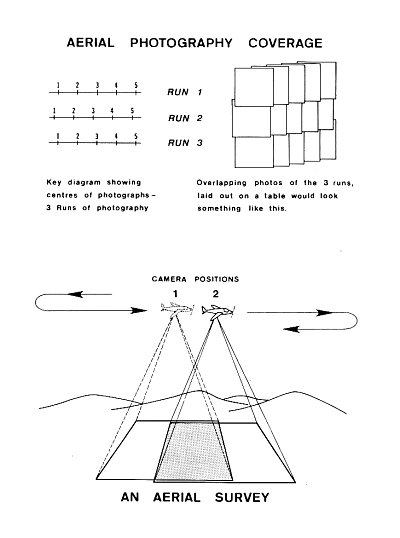
be made from the photographs. The camera exposes a line of photographs,
each frame overlapping the previous one. This is known as a run.
A number of runs of photographs might be made and each run will
overlap the preceding one. In this way a large area of country
will be covered by a series of overlapping photographs. The reason
for the overlapping is given under 'Photogrammetry'.
Either colour or black and white film may be used for aerial photography,
and for some purposes, infra red sensitive film is used.
Another use of photography is the procedure of orthophotos which
is described later under Photogrammetry'.
Click
for larger image
Remote Sensing
This term is used to describe methods of obtaining data from the earth by means
of instruments that are remote from the earth - that is, they are in the sky or
in space. Aerial photography is an example of remote sensing but there are others
which do not record information on photographic film. Conventional photography
can give excellent results and is used extensively but it requires good weather
conditions and it can record only that information which appears on the surface
of the ground. Radar is one method of remote sensing that is sometimes used,
and at certain wave lengths it can see through vegetation to the ground underneath.
Magnetometers are used in aircraft to record magnetic variations in the ground
below. This information tells geologists the nature of the earth in that area.
The Landsat satellite orbiting the earth uses a multi-spectral scanner which records
images beyond the visible spectrum and transmits them back to earth where they
are stored on computer tape. Negatives may be made from the tapes and prints
appear in what is known as false colour. As the scanner sees the infra red
end of the spectrum it is able to show things that conventional photographs cannot
show. In false colour, vegetation will appear red but dead trees (even though
they might still be covered in foliage) will appear brown. The cellulose in the
vegetation affects the infra red image. In time of war camouflage can be detected
in this way.
Photogrammetry
Photogrammetry is the science of making measurements from photographs. Sounds
simple? Well, it is not as straightforward as it may seem. The point is that
a photograph is not a map and it cannot be measured in the way that a map can.
The camera depicts, as a flat photograph, an area of the earth which may vary
considerably in height. The highest point on the area that has been photographed
will be at a larger scale than the lowest point. This is because the highest
point is closest to the camera lens and the scale is directly related to the distance
between the camera and the object (the ground). The lowest point is furthest
away from the camera so the scale at that point will be the smallest. The scale
will vary between these points. The only way that an aerial photograph could
be the same scale at every point would be if the ground was perfectly flat and
the camera perfectly level.
This is why stereoscopic instruments are used. Each photograph overlaps the previous
one - usually by about two thirds - so that part of each photograph depicts the
same area of ground from a different aspect. When the two are viewed together
through a stereoscope, a three-dimensional image is seen. This is referred to
as a model. There is nothing unusual about stereoscopy. It is the way you see
with your eyes. Each eye sees a picture from a different viewpoint and the brain
combines the two, enabling the viewer to see depth - the third dimension. If
you were to take two photographs of the same subject from two different aspects,
(the same distance from the subject and a short distance apart) you would have
a stereo pair. In other words when viewed through a stereoscope, a three-dimensional
picture would be seen. The stereoscope is an instrument which enables each eye
to see a separate picture which the brain puts together as a full, three-dimensional
one. Some stereoscopes use mirrors, arranged like two side-by-side periscopes
- one for each eye. This principle of stereoscopy is not just an optical illusion.
It is something that can be measured and photogrammetric plotting instruments
are designed to allow the operator to make precise measurements of height and
distance. The apparent displacement of objects, when viewed from different positions
is known as parallax, and it is the difference in parallax between the two images
that enables the operator to see depth and measure differences in elevation.
The photographs are printed on glass or film and are known as diapositives. The
photogrammetrist is able to plot roads, buildings, fences, contours and other
required information as he or she views the model, usually through a binocular
eyepiece. The map is built up on a table connected to the instrument through
a gearbox or pantograph. This information may also be stored on computer tape
(see 'Computer Technology).
Terrestrial Photogrammetry
There is another type of photogrammetry which uses photographs which have been
taken on the ground. This is known as terrestrial photogrammetry. By this method
measurements may be made of the scenes of road accidents or crimes. Industrial
components can be checked for excessive wear. The condition of buildings or statues
requiring restoration may be determined. Photogrammetric methods may be used
in conjunction with X-ray photography for both industrial and medical purposes.
Even photomicrography may be used in conjunction with photogrammetry. Stereo
microscopes are used with cameras that may be directly attached to them. These
are invaluable for medical and police forensic work. For example, bullets may
be examined and measured. Contour plans may be drawn in terrestrial work, just
as they are in aerial photogrammetry.
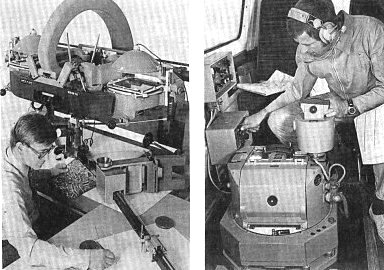
|
This
photogrammetrist plots from a Wild B8 stereoplotter. Glass
or film diapositives are directly beneath the lamp housings
on either side, and are viewed through the binocular eyepiece.
|
A
camera operator adjusts the exposure settings of a Wild R.C.
10 aerial camera at the beginning of a mission. |
Orthophotos
When can a photograph also be a map? When it is an orthophoto.
Orthophotos are made on a special kind of photogrammetric instrument
which rectifies the scale of a photograph so that a new, true
to scale photograph is obtained. The machine includes a drum
in which a sheet of unexposed film is placed. As with other photogrammetric
instruments, the photographs of the area to be mapped are printed
on glass or film and are known as diapositives. These are placed
in the machine and re-photographed through a tiny slit. So the
film in the drum is exposed, a little bit at a time, as the whole
of the picture is systematically scanned. As the exposure is
being made, the scale is being constantly corrected so that the
finished result is a photograph that is true to scale. The advantage
of an orthophoto is that it shows the usual information that can
be seen on a photograph but it can also be measured in the way
that any other map can. Sometimes contours are printed on it
as well, by photographic means.
Computer Technology
Over the last few years the computer has come into its own and
it has made inroads into cartography just as it has in other fields.
A vast area of country, covered by numerous aerial photographs,
is able to be mapped photogrammetrically with a minimum of information
established by ground survey. This is because the computer is
able to calculate accurately the data that is required as the
basis of the map, by measuring and comparing the known values.
This can save weeks of work by ground parties.
In the future we may see the establishment of data banks in which
maps are stored on computer tape. A data plotter will plot the
full map, when required, in ink on a plastic film, directly from
the tape. Already some agencies are storing maps in this way.
The map is plotted photogrammetrically but instead of (or as well
as) being drawn in pencil or ink it is fed straight on to computer
tape. It may be viewed by the operator on a display unit; parts
of it can be erased if necessary and particular sections of the
map can be viewed separately. Then, when required, the data plotter
will produce the map in drawn form. Scanners are able to 'read'
existing maps and store them on tape. There may even come a time
when contours will be digitised by computer and stored without
the aid of a person to visually plot them.
Drafting
Bringing the information conveyed on a map to the stage where
it is ready to go to the printer demands a great deal of time
and a high degree of skill. The work may be done by pen and ink
on stable base plastic sheets or it may be carried out by a method
known as scribing. This involves the use of a plastic sheet
which is coated with an opaque substance. The draftsman, working
over a light table, uses a scribing tool which cuts through the
coating (but not the sheet). The sheet can then be used as a
negative or master, with prints or lithographic plates being reproduced
from it. Alternatively, an etching dye can be applied to the scribed
sheet and the coating removed, leaving black linework. Either
way, scribing produces fine, uniform linework.
Names, numbers and symbols required on a map may be prepared on
photo-sensitive adhesive film known as stripping film or stick-on
materials such as Letraset or Chartpak can be used. Hand lettering
is too time consuming to be a practical proposition but lettering
is often stencilled on with the aid of Leroy or other lettering
guides. For greater accuracy, linework is sometimes drawn at
a larger scale than the final printed scale of the map. The process
camera is used to reduce this to the required size. Where a map
is being printed in colour the draftsman might need to produce
one drawing for each colour to be used.
(Note:- Not all maps are printed. Where few copies are required,
other methods of reproduction are employed).
Click
for larger image
Printing
When large numbers of maps are required they are usually printed by the lithographic
process, sometimes known as offset. The lithographic method originally used
stone blocks on which images were drawn with greasy chalk. The stone was treated
with acid, gum and water, and ink was applied. The ink was repelled from all
but the chalked areas. The inked image could then be transferred to paper. Because
water was a necessary part of the process, the paper would become wet and would
tend to buckle. Lithographs were at first made by hand but when the idea was
applied to mechanical printing the inconvenience was greater. To overcome this
problem a process was devised whereby the inked image was transferred to a roller
and from the roller to the paper - hence the term offset. The result was a
dry print.
In modern lithographic printing a stone is no longer used. An image is reproduced
photographically on to a flexible metal plate. (Yet another application of photography).
Full colour printing can be done by using four basic colours: the three primary
colours and black. However, some map printers who produce high quality work,
use a different ink for each colour instead of forming secondary colours through
the overlaying of primaries. This means that thirty or more different colours
might be printed on the one map. A great amount of skill is required on the part
of the printer to make sure that each image is registered correctly. The word
register refers to the printing of each inked image in exactly the right position
in relation to the other images (that is, other colours). You may have seen a
magazine in which coloured pictures have appeared blurred because the different inks used
to make up the full picture have not been overlaid in exactly the same place.
In other words, they were out of register. If a map is printed out of register,
a creek (printed blue) might appear in an incorrect position in relation to a
contour (brown). Or a fence (black) might appear on the wrong side of a road
(red). So it may be seen that correct registration is important both for accuracy
and appearance in the printing of a map. Marks are printed on corners of sheets,
in each colour used, so that registration can be checked.
Modern, high speed presses are able to cope with a number of different colours
at once and can deliver more than ten thousand sheets per hour.
Maps and their Users
A map is of little value if it does not supply the user with information that
he requires. More useful maps can result from evaluation by users and some feedback
to the producers of maps. Maps are sometimes made available to people through
libraries and their care and storage is a specialised field in itself.
We have seen something of the vital role that maps play in the life of our community,
and how diversified is the task of the cartographer. New technology will continue
to make inroads into cartography ensuring that it will remain a challenging and
rewarding profession.
"Cartography an introduction"
was written by John McCarthy, AMAIC and
published by the Australian Institute of Cartographers (N.S.W. Division) in 2001.
Diagrams by the Cartographic Section, Geological Survey of N.S.W., Department
of Mineral Resources and Development.
Cover design by John Roberts, MAIC.
The text of this booklet is reproduced here in full and unedited with the permission
of the family of the late John McCarthy and the Mapping Sciences Institute, Australia
(formerly the Australian Institute of Cartographers). Some images and all advertising
content have been omitted.
John McCarthy served with Adastra Aerial Surveys as a photogrammetrist from 1951
to1976 when the company ceased trading. John McCarthy passed away in March 1999.
|